| Target Load |
Actual Load |
ssj_ops |
| Target |
Actual |
| Calibration 1 |
|
|
3,082,383 |
| Calibration 2 |
|
|
3,233,990 |
| Calibration 3 |
|
|
3,236,449 |
| Calibration 4 |
|
|
3,241,078 |
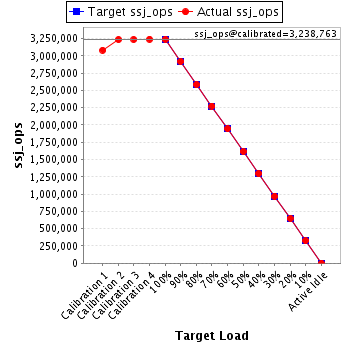
| ssj_ops@calibrated=3,238,763 |
| 100% |
100.0% |
3,238,763 |
3,238,142 |
| 90% |
90.1% |
2,914,887 |
2,919,126 |
| 80% |
79.8% |
2,591,011 |
2,583,246 |
| 70% |
70.2% |
2,267,134 |
2,274,175 |
| 60% |
60.0% |
1,943,258 |
1,943,082 |
| 50% |
50.0% |
1,619,382 |
1,618,490 |
| 40% |
40.0% |
1,295,505 |
1,296,825 |
| 30% |
30.0% |
971,629 |
970,994 |
| 20% |
20.0% |
647,753 |
648,713 |
| 10% |
10.1% |
323,876 |
325,509 |
| Active Idle |
|
0 |
0 |
| Hardware |
| Hardware Vendor: |
Fujitsu |
| Model: |
FUJITSU Server PRIMERGY CX2550 M1 |
| Form Factor: |
Blade |
| CPU Name: |
Intel Xeon E5-2699 v3 |
| CPU Characteristics: |
18-Core, 2.30GHz, 45MB L3 Cache |
| CPU Frequency (MHz): |
2300 |
| CPU(s) Enabled: |
36 cores, 2 chips, 18 cores/chip |
| Hardware Threads: |
72 (2 / core) |
| CPU(s) Orderable: |
1,2 chips |
| Primary Cache: |
32 KB I + 32 KB D on chip per core |
| Secondary Cache: |
256 KB I+D on chip per core |
| Tertiary Cache: |
45 MB I+D on chip per chip |
| Other Cache: |
None |
| Memory Amount (GB): |
64 |
| # and size of DIMM: |
8 x 8192 MB |
| Memory Details: |
8 GB DDR4, registered, ECC, 2133 MHz, PC4-2133R, DIMM, 2Rx8; slots 1A, 1B, 1C, 1D, 1E, 1F, 1G, 1H populated |
| Power Supply Quantity and Rating (W): |
None |
| Power Supply Details: |
N/A |
| Disk Drive: |
1 x SSD SATA 6G 64GB DOM N H-P, S26361-F5523-E64 |
| Disk Controller: |
Integrated SATA Controller |
| # and type of Network Interface Cards (NICs) Installed: |
2 x Intel I350 Gigabit Network Connection (onboard) |
| NICs Enabled in Firmware / OS / Connected: |
1/1/1 |
| Network Speed (Mbit): |
1000 |
| Keyboard: |
None |
| Mouse: |
None |
| Monitor: |
None |
| Optical Drives: |
No |
| Other Hardware: |
None |
| Software |
| Power Management: |
Enabled ("Fujitsu Enhanced Power Settings" power plan) |
| Operating System (OS): |
Microsoft Windows Server 2008 R2 Enterprise SP1 |
| OS Version: |
Version 6.1.7601 Service Pack 1 Build 7601 |
| Filesystem: |
NTFS |
| JVM Vendor: |
IBM Corporation |
| JVM Version: |
IBM J9 VM (build 2.6, JRE 1.7.0 Windows Server 2008 R2 amd64-64 20120322_106209 (JIT enabled, AOT enabled) |
| JVM Command-line Options: |
-Xmn825m -Xms975m -Xmx975m -Xaggressive -Xcompressedrefs -Xgcpolicy:gencon -XlockReservation -Xnoloa -XtlhPrefetch -Xlp -Xconcurrentlevel0 -Xthr:minimizeusercpu -Xgcthreads2 (-Xgcthreads1 for JVM5 and JVM23) |
| JVM Affinity: |
start /NODE [0,1,2,3] /AFFINITY [0x3,0xC,0x30,0xC0,0x300,0xC00,0x3000,0xC000,0x30000] |
| JVM Instances: |
36 |
| JVM Initial Heap (MB): |
975 |
| JVM Maximum Heap (MB): |
975 |
| JVM Address Bits: |
64 |
| Boot Firmware Version: |
R1.7.0 |
| Management Firmware Version: |
7.64F |
| Workload Version: |
SSJ 1.2.10 |
| Director Location: |
Controller |
| Other Software: |
IBM WebSphere Application Server V8.5.0.0, Microsoft Hotfix for Windows (KB2510206) |
| JVM Instance |
ssj_ops@100% |
| Node_01.001 |
89,114 |
| Node_01.002 |
89,930 |
| Node_01.003 |
90,594 |
| Node_01.004 |
90,369 |
| Node_01.005 |
85,765 |
| Node_01.006 |
90,775 |
| Node_01.007 |
91,448 |
| Node_01.008 |
90,913 |
| Node_01.009 |
91,591 |
| Node_01.010 |
87,850 |
| Node_01.011 |
88,916 |
| Node_01.012 |
90,909 |
| Node_01.013 |
91,078 |
| Node_01.014 |
90,342 |
| Node_01.015 |
88,926 |
| Node_01.016 |
90,071 |
| Node_01.017 |
91,422 |
| Node_01.018 |
90,581 |
| Node_01.019 |
89,058 |
| Node_01.020 |
90,515 |
| Node_01.021 |
90,200 |
| Node_01.022 |
90,847 |
| Node_01.023 |
86,772 |
| Node_01.024 |
91,072 |
| Node_01.025 |
89,676 |
| Node_01.026 |
91,479 |
| Node_01.027 |
91,787 |
| Node_01.028 |
87,242 |
| Node_01.029 |
89,442 |
| Node_01.030 |
89,367 |
| Node_01.031 |
90,158 |
| Node_01.032 |
89,483 |
| Node_01.033 |
88,452 |
| Node_01.034 |
90,111 |
| Node_01.035 |
91,111 |
| Node_01.036 |
90,774 |
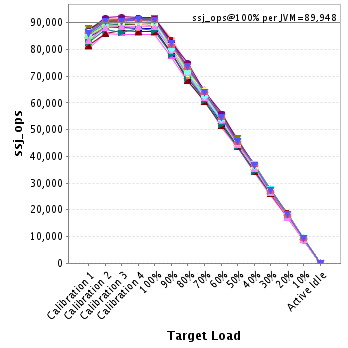
| ssj_ops@100% |
3,238,142 |
| ssj_ops@100% per JVM |
89,948 |
JVM 'Node_01.001' Scores:
| Target Load |
Actual Load |
ssj_ops |
| Target |
Actual |
| Calibration 1 |
|
|
85,389 |
| Calibration 2 |
|
|
89,525 |
| Calibration 3 |
|
|
89,173 |
| Calibration 4 |
|
|
89,372 |
| ssj_ops@calibrated=89,272 |
| 100% |
99.8% |
89,272 |
89,114 |
| 90% |
90.9% |
80,345 |
81,110 |
| 80% |
80.0% |
71,418 |
71,396 |
| 70% |
70.9% |
62,491 |
63,258 |
| 60% |
59.9% |
53,563 |
53,464 |
| 50% |
50.8% |
44,636 |
45,390 |
| 40% |
40.7% |
35,709 |
36,330 |
| 30% |
30.5% |
26,782 |
27,272 |
| 20% |
19.9% |
17,854 |
17,805 |
| 10% |
10.3% |
8,927 |
9,232 |
| Active Idle |
|
0 |
0 |
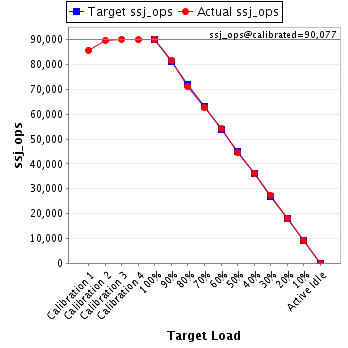
JVM 'Node_01.002' Scores:
| Target Load |
Actual Load |
ssj_ops |
| Target |
Actual |
| Calibration 1 |
|
|
85,718 |
| Calibration 2 |
|
|
89,685 |
| Calibration 3 |
|
|
90,238 |
| Calibration 4 |
|
|
89,917 |
| ssj_ops@calibrated=90,077 |
| 100% |
99.8% |
90,077 |
89,930 |
| 90% |
90.6% |
81,069 |
81,599 |
| 80% |
79.1% |
72,062 |
71,216 |
| 70% |
69.8% |
63,054 |
62,833 |
| 60% |
60.1% |
54,046 |
54,136 |
| 50% |
49.3% |
45,039 |
44,423 |
| 40% |
40.3% |
36,031 |
36,292 |
| 30% |
30.5% |
27,023 |
27,448 |
| 20% |
20.0% |
18,015 |
17,983 |
| 10% |
10.1% |
9,008 |
9,129 |
| Active Idle |
|
0 |
0 |
JVM 'Node_01.003' Scores:
| Target Load |
Actual Load |
ssj_ops |
| Target |
Actual |
| Calibration 1 |
|
|
86,272 |
| Calibration 2 |
|
|
90,781 |
| Calibration 3 |
|
|
90,139 |
| Calibration 4 |
|
|
90,513 |
| ssj_ops@calibrated=90,326 |
| 100% |
100.3% |
90,326 |
90,594 |
| 90% |
90.1% |
81,294 |
81,420 |
| 80% |
79.3% |
72,261 |
71,606 |
| 70% |
70.7% |
63,228 |
63,825 |
| 60% |
59.4% |
54,196 |
53,643 |
| 50% |
50.2% |
45,163 |
45,365 |
| 40% |
40.7% |
36,131 |
36,776 |
| 30% |
29.8% |
27,098 |
26,879 |
| 20% |
20.2% |
18,065 |
18,208 |
| 10% |
10.3% |
9,033 |
9,267 |
| Active Idle |
|
0 |
0 |
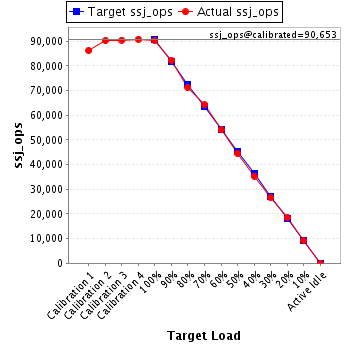
JVM 'Node_01.004' Scores:
| Target Load |
Actual Load |
ssj_ops |
| Target |
Actual |
| Calibration 1 |
|
|
86,203 |
| Calibration 2 |
|
|
90,247 |
| Calibration 3 |
|
|
90,475 |
| Calibration 4 |
|
|
90,831 |
| ssj_ops@calibrated=90,653 |
| 100% |
99.7% |
90,653 |
90,369 |
| 90% |
90.8% |
81,587 |
82,338 |
| 80% |
78.6% |
72,522 |
71,239 |
| 70% |
70.8% |
63,457 |
64,154 |
| 60% |
59.6% |
54,392 |
54,018 |
| 50% |
49.1% |
45,326 |
44,552 |
| 40% |
39.0% |
36,261 |
35,329 |
| 30% |
29.5% |
27,196 |
26,700 |
| 20% |
20.3% |
18,131 |
18,374 |
| 10% |
10.0% |
9,065 |
9,092 |
| Active Idle |
|
0 |
0 |
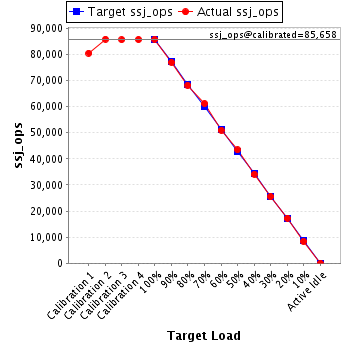
JVM 'Node_01.005' Scores:
| Target Load |
Actual Load |
ssj_ops |
| Target |
Actual |
| Calibration 1 |
|
|
80,480 |
| Calibration 2 |
|
|
85,837 |
| Calibration 3 |
|
|
85,631 |
| Calibration 4 |
|
|
85,685 |
| ssj_ops@calibrated=85,658 |
| 100% |
100.1% |
85,658 |
85,765 |
| 90% |
89.9% |
77,092 |
76,987 |
| 80% |
79.5% |
68,527 |
68,133 |
| 70% |
71.4% |
59,961 |
61,167 |
| 60% |
59.4% |
51,395 |
50,910 |
| 50% |
50.7% |
42,829 |
43,415 |
| 40% |
39.8% |
34,263 |
34,079 |
| 30% |
29.8% |
25,697 |
25,515 |
| 20% |
20.2% |
17,132 |
17,287 |
| 10% |
9.8% |
8,566 |
8,375 |
| Active Idle |
|
0 |
0 |
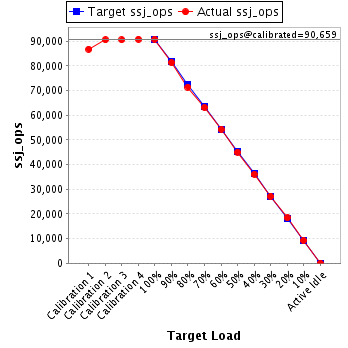
JVM 'Node_01.006' Scores:
| Target Load |
Actual Load |
ssj_ops |
| Target |
Actual |
| Calibration 1 |
|
|
86,780 |
| Calibration 2 |
|
|
90,516 |
| Calibration 3 |
|
|
90,506 |
| Calibration 4 |
|
|
90,813 |
| ssj_ops@calibrated=90,659 |
| 100% |
100.1% |
90,659 |
90,775 |
| 90% |
89.7% |
81,594 |
81,307 |
| 80% |
78.7% |
72,528 |
71,383 |
| 70% |
69.6% |
63,462 |
63,058 |
| 60% |
59.8% |
54,396 |
54,237 |
| 50% |
49.7% |
45,330 |
45,084 |
| 40% |
39.8% |
36,264 |
36,052 |
| 30% |
30.0% |
27,198 |
27,168 |
| 20% |
20.3% |
18,132 |
18,408 |
| 10% |
10.2% |
9,066 |
9,250 |
| Active Idle |
|
0 |
0 |
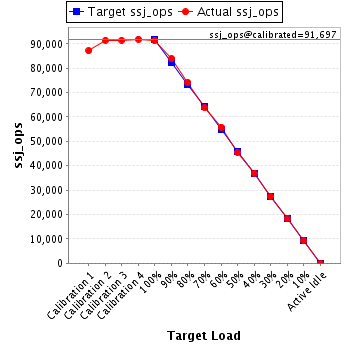
JVM 'Node_01.007' Scores:
| Target Load |
Actual Load |
ssj_ops |
| Target |
Actual |
| Calibration 1 |
|
|
87,143 |
| Calibration 2 |
|
|
91,473 |
| Calibration 3 |
|
|
91,482 |
| Calibration 4 |
|
|
91,912 |
| ssj_ops@calibrated=91,697 |
| 100% |
99.7% |
91,697 |
91,448 |
| 90% |
91.5% |
82,528 |
83,922 |
| 80% |
80.9% |
73,358 |
74,183 |
| 70% |
69.6% |
64,188 |
63,862 |
| 60% |
60.9% |
55,018 |
55,826 |
| 50% |
49.7% |
45,849 |
45,536 |
| 40% |
40.4% |
36,679 |
37,011 |
| 30% |
29.9% |
27,509 |
27,407 |
| 20% |
19.8% |
18,339 |
18,166 |
| 10% |
10.0% |
9,170 |
9,187 |
| Active Idle |
|
0 |
0 |
JVM 'Node_01.008' Scores:
| Target Load |
Actual Load |
ssj_ops |
| Target |
Actual |
| Calibration 1 |
|
|
86,865 |
| Calibration 2 |
|
|
90,541 |
| Calibration 3 |
|
|
91,185 |
| Calibration 4 |
|
|
90,981 |
| ssj_ops@calibrated=91,083 |
| 100% |
99.8% |
91,083 |
90,913 |
| 90% |
89.2% |
81,975 |
81,289 |
| 80% |
80.1% |
72,866 |
72,935 |
| 70% |
70.0% |
63,758 |
63,795 |
| 60% |
61.1% |
54,650 |
55,694 |
| 50% |
50.1% |
45,542 |
45,647 |
| 40% |
40.2% |
36,433 |
36,638 |
| 30% |
30.5% |
27,325 |
27,760 |
| 20% |
20.5% |
18,217 |
18,662 |
| 10% |
10.0% |
9,108 |
9,137 |
| Active Idle |
|
0 |
0 |
JVM 'Node_01.009' Scores:
| Target Load |
Actual Load |
ssj_ops |
| Target |
Actual |
| Calibration 1 |
|
|
87,136 |
| Calibration 2 |
|
|
91,122 |
| Calibration 3 |
|
|
91,267 |
| Calibration 4 |
|
|
91,540 |
| ssj_ops@calibrated=91,404 |
| 100% |
100.2% |
91,404 |
91,591 |
| 90% |
91.2% |
82,263 |
83,385 |
| 80% |
79.9% |
73,123 |
73,059 |
| 70% |
70.5% |
63,982 |
64,477 |
| 60% |
60.1% |
54,842 |
54,977 |
| 50% |
50.0% |
45,702 |
45,669 |
| 40% |
39.9% |
36,561 |
36,441 |
| 30% |
29.3% |
27,421 |
26,785 |
| 20% |
20.5% |
18,281 |
18,779 |
| 10% |
10.0% |
9,140 |
9,146 |
| Active Idle |
|
0 |
0 |
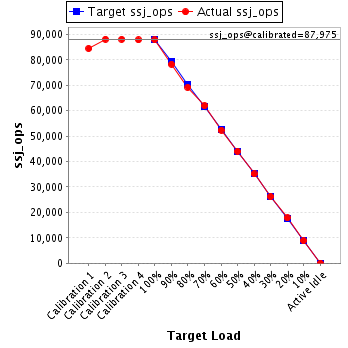
JVM 'Node_01.010' Scores:
| Target Load |
Actual Load |
ssj_ops |
| Target |
Actual |
| Calibration 1 |
|
|
84,476 |
| Calibration 2 |
|
|
88,139 |
| Calibration 3 |
|
|
88,129 |
| Calibration 4 |
|
|
87,820 |
| ssj_ops@calibrated=87,975 |
| 100% |
99.9% |
87,975 |
87,850 |
| 90% |
89.0% |
79,177 |
78,303 |
| 80% |
78.6% |
70,380 |
69,175 |
| 70% |
70.4% |
61,582 |
61,892 |
| 60% |
59.5% |
52,785 |
52,324 |
| 50% |
50.1% |
43,987 |
44,041 |
| 40% |
39.9% |
35,190 |
35,112 |
| 30% |
29.7% |
26,392 |
26,145 |
| 20% |
20.3% |
17,595 |
17,850 |
| 10% |
10.0% |
8,797 |
8,833 |
| Active Idle |
|
0 |
0 |
JVM 'Node_01.011' Scores:
| Target Load |
Actual Load |
ssj_ops |
| Target |
Actual |
| Calibration 1 |
|
|
82,944 |
| Calibration 2 |
|
|
88,836 |
| Calibration 3 |
|
|
88,655 |
| Calibration 4 |
|
|
88,961 |
| ssj_ops@calibrated=88,808 |
| 100% |
100.1% |
88,808 |
88,916 |
| 90% |
90.4% |
79,927 |
80,301 |
| 80% |
79.1% |
71,047 |
70,236 |
| 70% |
70.0% |
62,166 |
62,159 |
| 60% |
59.6% |
53,285 |
52,925 |
| 50% |
49.6% |
44,404 |
44,084 |
| 40% |
39.5% |
35,523 |
35,080 |
| 30% |
30.5% |
26,642 |
27,049 |
| 20% |
20.2% |
17,762 |
17,941 |
| 10% |
9.9% |
8,881 |
8,791 |
| Active Idle |
|
0 |
0 |
JVM 'Node_01.012' Scores:
| Target Load |
Actual Load |
ssj_ops |
| Target |
Actual |
| Calibration 1 |
|
|
86,239 |
| Calibration 2 |
|
|
90,710 |
| Calibration 3 |
|
|
90,411 |
| Calibration 4 |
|
|
91,186 |
| ssj_ops@calibrated=90,798 |
| 100% |
100.1% |
90,798 |
90,909 |
| 90% |
89.8% |
81,719 |
81,550 |
| 80% |
80.2% |
72,639 |
72,854 |
| 70% |
70.0% |
63,559 |
63,550 |
| 60% |
60.0% |
54,479 |
54,514 |
| 50% |
50.5% |
45,399 |
45,864 |
| 40% |
39.7% |
36,319 |
36,009 |
| 30% |
30.4% |
27,240 |
27,566 |
| 20% |
20.1% |
18,160 |
18,247 |
| 10% |
10.1% |
9,080 |
9,179 |
| Active Idle |
|
0 |
0 |
JVM 'Node_01.013' Scores:
| Target Load |
Actual Load |
ssj_ops |
| Target |
Actual |
| Calibration 1 |
|
|
86,589 |
| Calibration 2 |
|
|
90,384 |
| Calibration 3 |
|
|
91,317 |
| Calibration 4 |
|
|
91,120 |
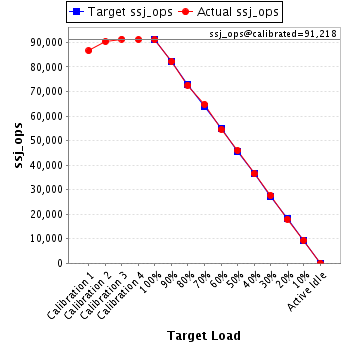
| ssj_ops@calibrated=91,218 |
| 100% |
99.8% |
91,218 |
91,078 |
| 90% |
90.1% |
82,096 |
82,215 |
| 80% |
79.5% |
72,975 |
72,558 |
| 70% |
71.0% |
63,853 |
64,749 |
| 60% |
59.7% |
54,731 |
54,487 |
| 50% |
50.3% |
45,609 |
45,909 |
| 40% |
40.0% |
36,487 |
36,496 |
| 30% |
30.3% |
27,365 |
27,614 |
| 20% |
19.7% |
18,244 |
17,950 |
| 10% |
10.3% |
9,122 |
9,350 |
| Active Idle |
|
0 |
0 |
JVM 'Node_01.014' Scores:
| Target Load |
Actual Load |
ssj_ops |
| Target |
Actual |
| Calibration 1 |
|
|
86,058 |
| Calibration 2 |
|
|
90,370 |
| Calibration 3 |
|
|
90,191 |
| Calibration 4 |
|
|
90,214 |
| ssj_ops@calibrated=90,203 |
| 100% |
100.2% |
90,203 |
90,342 |
| 90% |
91.0% |
81,182 |
82,115 |
| 80% |
79.9% |
72,162 |
72,105 |
| 70% |
70.2% |
63,142 |
63,294 |
| 60% |
60.5% |
54,122 |
54,536 |
| 50% |
50.3% |
45,101 |
45,350 |
| 40% |
40.2% |
36,081 |
36,251 |
| 30% |
29.6% |
27,061 |
26,721 |
| 20% |
20.1% |
18,041 |
18,158 |
| 10% |
10.1% |
9,020 |
9,117 |
| Active Idle |
|
0 |
0 |
JVM 'Node_01.015' Scores:
| Target Load |
Actual Load |
ssj_ops |
| Target |
Actual |
| Calibration 1 |
|
|
85,496 |
| Calibration 2 |
|
|
89,733 |
| Calibration 3 |
|
|
89,303 |
| Calibration 4 |
|
|
88,907 |
| ssj_ops@calibrated=89,105 |
| 100% |
99.8% |
89,105 |
88,926 |
| 90% |
89.7% |
80,194 |
79,960 |
| 80% |
79.9% |
71,284 |
71,235 |
| 70% |
70.3% |
62,373 |
62,676 |
| 60% |
60.0% |
53,463 |
53,423 |
| 50% |
49.5% |
44,552 |
44,117 |
| 40% |
39.4% |
35,642 |
35,091 |
| 30% |
29.9% |
26,731 |
26,629 |
| 20% |
20.2% |
17,821 |
18,012 |
| 10% |
10.2% |
8,910 |
9,108 |
| Active Idle |
|
0 |
0 |
JVM 'Node_01.016' Scores:
| Target Load |
Actual Load |
ssj_ops |
| Target |
Actual |
| Calibration 1 |
|
|
85,847 |
| Calibration 2 |
|
|
89,936 |
| Calibration 3 |
|
|
90,466 |
| Calibration 4 |
|
|
90,747 |
| ssj_ops@calibrated=90,606 |
| 100% |
99.4% |
90,606 |
90,071 |
| 90% |
90.8% |
81,546 |
82,254 |
| 80% |
79.1% |
72,485 |
71,654 |
| 70% |
70.4% |
63,424 |
63,780 |
| 60% |
60.5% |
54,364 |
54,861 |
| 50% |
49.9% |
45,303 |
45,198 |
| 40% |
40.1% |
36,242 |
36,354 |
| 30% |
30.6% |
27,182 |
27,766 |
| 20% |
19.7% |
18,121 |
17,871 |
| 10% |
10.0% |
9,061 |
9,054 |
| Active Idle |
|
0 |
0 |
JVM 'Node_01.017' Scores:
| Target Load |
Actual Load |
ssj_ops |
| Target |
Actual |
| Calibration 1 |
|
|
86,821 |
| Calibration 2 |
|
|
91,317 |
| Calibration 3 |
|
|
91,358 |
| Calibration 4 |
|
|
91,545 |
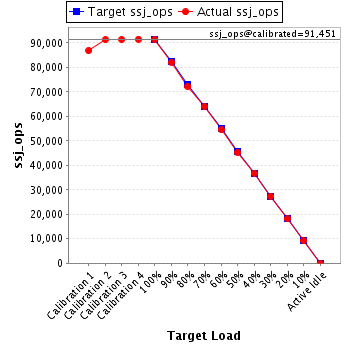
| ssj_ops@calibrated=91,451 |
| 100% |
100.0% |
91,451 |
91,422 |
| 90% |
89.8% |
82,306 |
82,110 |
| 80% |
79.1% |
73,161 |
72,320 |
| 70% |
69.8% |
64,016 |
63,876 |
| 60% |
59.7% |
54,871 |
54,552 |
| 50% |
49.6% |
45,726 |
45,321 |
| 40% |
40.2% |
36,581 |
36,795 |
| 30% |
30.0% |
27,435 |
27,424 |
| 20% |
19.8% |
18,290 |
18,141 |
| 10% |
9.9% |
9,145 |
9,095 |
| Active Idle |
|
0 |
0 |
JVM 'Node_01.018' Scores:
| Target Load |
Actual Load |
ssj_ops |
| Target |
Actual |
| Calibration 1 |
|
|
86,601 |
| Calibration 2 |
|
|
90,648 |
| Calibration 3 |
|
|
90,750 |
| Calibration 4 |
|
|
90,323 |
| ssj_ops@calibrated=90,537 |
| 100% |
100.0% |
90,537 |
90,581 |
| 90% |
90.7% |
81,483 |
82,162 |
| 80% |
79.9% |
72,429 |
72,381 |
| 70% |
70.6% |
63,376 |
63,889 |
| 60% |
59.7% |
54,322 |
54,079 |
| 50% |
49.6% |
45,268 |
44,947 |
| 40% |
40.7% |
36,215 |
36,834 |
| 30% |
29.8% |
27,161 |
26,954 |
| 20% |
19.9% |
18,107 |
18,052 |
| 10% |
9.7% |
9,054 |
8,783 |
| Active Idle |
|
0 |
0 |
JVM 'Node_01.019' Scores:
| Target Load |
Actual Load |
ssj_ops |
| Target |
Actual |
| Calibration 1 |
|
|
85,694 |
| Calibration 2 |
|
|
89,262 |
| Calibration 3 |
|
|
88,856 |
| Calibration 4 |
|
|
88,977 |
| ssj_ops@calibrated=88,916 |
| 100% |
100.2% |
88,916 |
89,058 |
| 90% |
90.0% |
80,025 |
80,018 |
| 80% |
80.3% |
71,133 |
71,391 |
| 70% |
71.0% |
62,241 |
63,143 |
| 60% |
59.7% |
53,350 |
53,121 |
| 50% |
50.4% |
44,458 |
44,812 |
| 40% |
39.9% |
35,566 |
35,490 |
| 30% |
29.8% |
26,675 |
26,469 |
| 20% |
19.9% |
17,783 |
17,715 |
| 10% |
10.1% |
8,892 |
8,962 |
| Active Idle |
|
0 |
0 |
JVM 'Node_01.020' Scores:
| Target Load |
Actual Load |
ssj_ops |
| Target |
Actual |
| Calibration 1 |
|
|
86,055 |
| Calibration 2 |
|
|
90,035 |
| Calibration 3 |
|
|
90,233 |
| Calibration 4 |
|
|
90,200 |
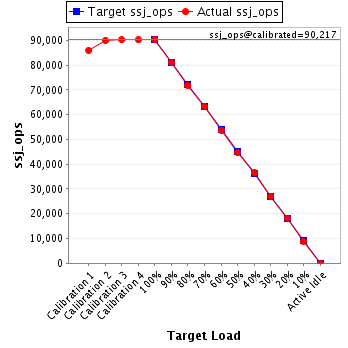
| ssj_ops@calibrated=90,217 |
| 100% |
100.3% |
90,217 |
90,515 |
| 90% |
90.0% |
81,195 |
81,188 |
| 80% |
79.6% |
72,173 |
71,801 |
| 70% |
70.1% |
63,152 |
63,200 |
| 60% |
59.5% |
54,130 |
53,672 |
| 50% |
49.6% |
45,108 |
44,711 |
| 40% |
40.5% |
36,087 |
36,559 |
| 30% |
29.9% |
27,065 |
26,996 |
| 20% |
20.2% |
18,043 |
18,246 |
| 10% |
10.0% |
9,022 |
8,979 |
| Active Idle |
|
0 |
0 |
JVM 'Node_01.021' Scores:
| Target Load |
Actual Load |
ssj_ops |
| Target |
Actual |
| Calibration 1 |
|
|
86,338 |
| Calibration 2 |
|
|
90,238 |
| Calibration 3 |
|
|
90,240 |
| Calibration 4 |
|
|
90,618 |
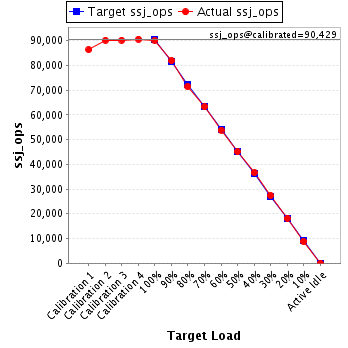
| ssj_ops@calibrated=90,429 |
| 100% |
99.7% |
90,429 |
90,200 |
| 90% |
90.6% |
81,386 |
81,935 |
| 80% |
79.1% |
72,343 |
71,488 |
| 70% |
69.9% |
63,300 |
63,219 |
| 60% |
59.6% |
54,257 |
53,863 |
| 50% |
49.9% |
45,214 |
45,168 |
| 40% |
40.5% |
36,172 |
36,606 |
| 30% |
30.3% |
27,129 |
27,421 |
| 20% |
20.1% |
18,086 |
18,208 |
| 10% |
9.7% |
9,043 |
8,808 |
| Active Idle |
|
0 |
0 |
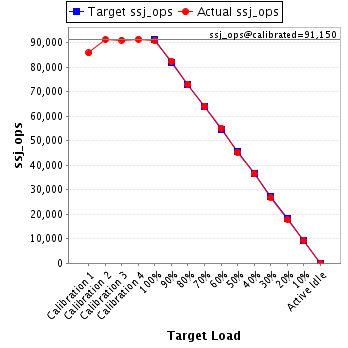
JVM 'Node_01.022' Scores:
| Target Load |
Actual Load |
ssj_ops |
| Target |
Actual |
| Calibration 1 |
|
|
85,720 |
| Calibration 2 |
|
|
91,168 |
| Calibration 3 |
|
|
90,953 |
| Calibration 4 |
|
|
91,347 |
| ssj_ops@calibrated=91,150 |
| 100% |
99.7% |
91,150 |
90,847 |
| 90% |
90.4% |
82,035 |
82,363 |
| 80% |
80.0% |
72,920 |
72,933 |
| 70% |
70.3% |
63,805 |
64,046 |
| 60% |
60.3% |
54,690 |
55,005 |
| 50% |
49.7% |
45,575 |
45,303 |
| 40% |
40.0% |
36,460 |
36,415 |
| 30% |
29.6% |
27,345 |
26,958 |
| 20% |
19.6% |
18,230 |
17,837 |
| 10% |
10.0% |
9,115 |
9,100 |
| Active Idle |
|
0 |
0 |
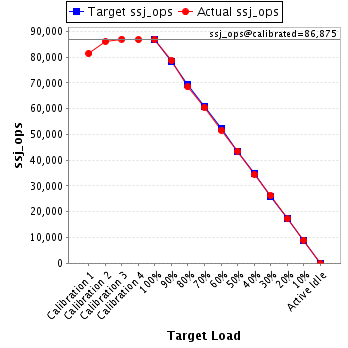
JVM 'Node_01.023' Scores:
| Target Load |
Actual Load |
ssj_ops |
| Target |
Actual |
| Calibration 1 |
|
|
81,428 |
| Calibration 2 |
|
|
86,071 |
| Calibration 3 |
|
|
86,971 |
| Calibration 4 |
|
|
86,780 |
| ssj_ops@calibrated=86,875 |
| 100% |
99.9% |
86,875 |
86,772 |
| 90% |
90.6% |
78,188 |
78,703 |
| 80% |
78.8% |
69,500 |
68,446 |
| 70% |
69.7% |
60,813 |
60,555 |
| 60% |
59.5% |
52,125 |
51,676 |
| 50% |
50.1% |
43,438 |
43,559 |
| 40% |
39.6% |
34,750 |
34,424 |
| 30% |
30.2% |
26,063 |
26,248 |
| 20% |
19.8% |
17,375 |
17,237 |
| 10% |
10.3% |
8,688 |
8,987 |
| Active Idle |
|
0 |
0 |
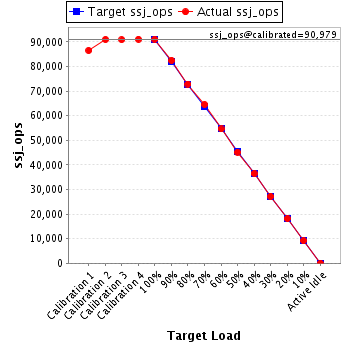
JVM 'Node_01.024' Scores:
| Target Load |
Actual Load |
ssj_ops |
| Target |
Actual |
| Calibration 1 |
|
|
86,496 |
| Calibration 2 |
|
|
90,968 |
| Calibration 3 |
|
|
90,858 |
| Calibration 4 |
|
|
91,100 |
| ssj_ops@calibrated=90,979 |
| 100% |
100.1% |
90,979 |
91,072 |
| 90% |
90.7% |
81,881 |
82,509 |
| 80% |
80.1% |
72,783 |
72,854 |
| 70% |
70.9% |
63,685 |
64,536 |
| 60% |
60.0% |
54,587 |
54,603 |
| 50% |
49.7% |
45,490 |
45,221 |
| 40% |
40.1% |
36,392 |
36,448 |
| 30% |
29.9% |
27,294 |
27,193 |
| 20% |
19.9% |
18,196 |
18,136 |
| 10% |
10.1% |
9,098 |
9,150 |
| Active Idle |
|
0 |
0 |
JVM 'Node_01.025' Scores:
| Target Load |
Actual Load |
ssj_ops |
| Target |
Actual |
| Calibration 1 |
|
|
85,438 |
| Calibration 2 |
|
|
89,491 |
| Calibration 3 |
|
|
89,349 |
| Calibration 4 |
|
|
89,727 |
| ssj_ops@calibrated=89,538 |
| 100% |
100.2% |
89,538 |
89,676 |
| 90% |
89.4% |
80,584 |
80,062 |
| 80% |
80.7% |
71,630 |
72,235 |
| 70% |
70.0% |
62,676 |
62,638 |
| 60% |
60.4% |
53,723 |
54,109 |
| 50% |
49.9% |
44,769 |
44,648 |
| 40% |
39.8% |
35,815 |
35,667 |
| 30% |
30.6% |
26,861 |
27,435 |
| 20% |
20.4% |
17,908 |
18,241 |
| 10% |
9.9% |
8,954 |
8,850 |
| Active Idle |
|
0 |
0 |
JVM 'Node_01.026' Scores:
| Target Load |
Actual Load |
ssj_ops |
| Target |
Actual |
| Calibration 1 |
|
|
87,905 |
| Calibration 2 |
|
|
90,653 |
| Calibration 3 |
|
|
91,080 |
| Calibration 4 |
|
|
91,093 |
| ssj_ops@calibrated=91,086 |
| 100% |
100.4% |
91,086 |
91,479 |
| 90% |
89.6% |
81,978 |
81,636 |
| 80% |
81.1% |
72,869 |
73,894 |
| 70% |
69.6% |
63,760 |
63,434 |
| 60% |
60.5% |
54,652 |
55,128 |
| 50% |
51.0% |
45,543 |
46,488 |
| 40% |
39.6% |
36,435 |
36,090 |
| 30% |
29.9% |
27,326 |
27,256 |
| 20% |
20.1% |
18,217 |
18,295 |
| 10% |
10.2% |
9,109 |
9,250 |
| Active Idle |
|
0 |
0 |
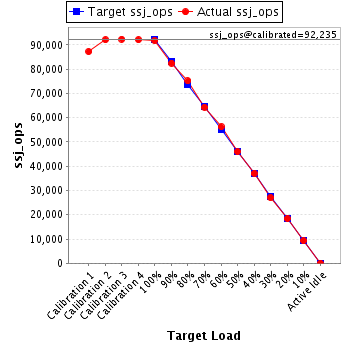
JVM 'Node_01.027' Scores:
| Target Load |
Actual Load |
ssj_ops |
| Target |
Actual |
| Calibration 1 |
|
|
87,236 |
| Calibration 2 |
|
|
92,068 |
| Calibration 3 |
|
|
92,372 |
| Calibration 4 |
|
|
92,098 |
| ssj_ops@calibrated=92,235 |
| 100% |
99.5% |
92,235 |
91,787 |
| 90% |
89.4% |
83,012 |
82,472 |
| 80% |
81.5% |
73,788 |
75,144 |
| 70% |
69.8% |
64,565 |
64,368 |
| 60% |
61.0% |
55,341 |
56,253 |
| 50% |
49.8% |
46,118 |
45,960 |
| 40% |
40.1% |
36,894 |
37,007 |
| 30% |
29.3% |
27,671 |
27,009 |
| 20% |
19.9% |
18,447 |
18,375 |
| 10% |
10.1% |
9,224 |
9,292 |
| Active Idle |
|
0 |
0 |
JVM 'Node_01.028' Scores:
| Target Load |
Actual Load |
ssj_ops |
| Target |
Actual |
| Calibration 1 |
|
|
82,725 |
| Calibration 2 |
|
|
87,276 |
| Calibration 3 |
|
|
86,454 |
| Calibration 4 |
|
|
87,742 |
| ssj_ops@calibrated=87,098 |
| 100% |
100.2% |
87,098 |
87,242 |
| 90% |
89.7% |
78,388 |
78,102 |
| 80% |
79.7% |
69,679 |
69,428 |
| 70% |
70.0% |
60,969 |
60,961 |
| 60% |
59.8% |
52,259 |
52,098 |
| 50% |
50.1% |
43,549 |
43,603 |
| 40% |
39.6% |
34,839 |
34,500 |
| 30% |
30.3% |
26,129 |
26,423 |
| 20% |
19.9% |
17,420 |
17,316 |
| 10% |
10.4% |
8,710 |
9,075 |
| Active Idle |
|
0 |
0 |
JVM 'Node_01.029' Scores:
| Target Load |
Actual Load |
ssj_ops |
| Target |
Actual |
| Calibration 1 |
|
|
84,856 |
| Calibration 2 |
|
|
88,682 |
| Calibration 3 |
|
|
88,829 |
| Calibration 4 |
|
|
88,336 |
| ssj_ops@calibrated=88,583 |
| 100% |
101.0% |
88,583 |
89,442 |
| 90% |
90.0% |
79,724 |
79,713 |
| 80% |
79.5% |
70,866 |
70,427 |
| 70% |
70.0% |
62,008 |
62,014 |
| 60% |
60.3% |
53,150 |
53,440 |
| 50% |
50.4% |
44,291 |
44,637 |
| 40% |
39.8% |
35,433 |
35,281 |
| 30% |
30.2% |
26,575 |
26,721 |
| 20% |
19.8% |
17,717 |
17,563 |
| 10% |
9.5% |
8,858 |
8,400 |
| Active Idle |
|
0 |
0 |
JVM 'Node_01.030' Scores:
| Target Load |
Actual Load |
ssj_ops |
| Target |
Actual |
| Calibration 1 |
|
|
86,343 |
| Calibration 2 |
|
|
89,465 |
| Calibration 3 |
|
|
89,513 |
| Calibration 4 |
|
|
89,781 |
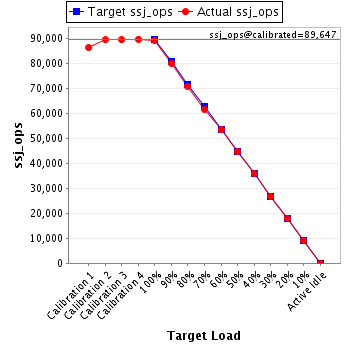
| ssj_ops@calibrated=89,647 |
| 100% |
99.7% |
89,647 |
89,367 |
| 90% |
89.4% |
80,682 |
80,131 |
| 80% |
79.1% |
71,717 |
70,933 |
| 70% |
68.8% |
62,753 |
61,695 |
| 60% |
59.6% |
53,788 |
53,449 |
| 50% |
49.9% |
44,823 |
44,717 |
| 40% |
40.0% |
35,859 |
35,888 |
| 30% |
29.9% |
26,894 |
26,779 |
| 20% |
20.1% |
17,929 |
18,021 |
| 10% |
10.1% |
8,965 |
9,029 |
| Active Idle |
|
0 |
0 |
JVM 'Node_01.031' Scores:
| Target Load |
Actual Load |
ssj_ops |
| Target |
Actual |
| Calibration 1 |
|
|
85,168 |
| Calibration 2 |
|
|
89,150 |
| Calibration 3 |
|
|
89,918 |
| Calibration 4 |
|
|
90,238 |
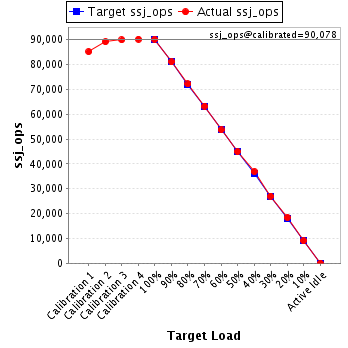
| ssj_ops@calibrated=90,078 |
| 100% |
100.1% |
90,078 |
90,158 |
| 90% |
90.0% |
81,070 |
81,046 |
| 80% |
80.2% |
72,062 |
72,210 |
| 70% |
70.3% |
63,055 |
63,318 |
| 60% |
59.6% |
54,047 |
53,702 |
| 50% |
49.8% |
45,039 |
44,893 |
| 40% |
41.0% |
36,031 |
36,897 |
| 30% |
30.0% |
27,023 |
27,066 |
| 20% |
20.5% |
18,016 |
18,429 |
| 10% |
10.0% |
9,008 |
9,025 |
| Active Idle |
|
0 |
0 |
JVM 'Node_01.032' Scores:
| Target Load |
Actual Load |
ssj_ops |
| Target |
Actual |
| Calibration 1 |
|
|
86,151 |
| Calibration 2 |
|
|
90,439 |
| Calibration 3 |
|
|
90,105 |
| Calibration 4 |
|
|
89,590 |
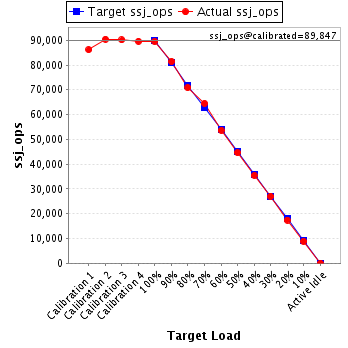
| ssj_ops@calibrated=89,847 |
| 100% |
99.6% |
89,847 |
89,483 |
| 90% |
90.6% |
80,863 |
81,415 |
| 80% |
78.9% |
71,878 |
70,877 |
| 70% |
71.8% |
62,893 |
64,519 |
| 60% |
59.7% |
53,908 |
53,599 |
| 50% |
49.6% |
44,924 |
44,603 |
| 40% |
39.4% |
35,939 |
35,412 |
| 30% |
30.1% |
26,954 |
27,036 |
| 20% |
19.4% |
17,969 |
17,441 |
| 10% |
9.9% |
8,985 |
8,896 |
| Active Idle |
|
0 |
0 |
JVM 'Node_01.033' Scores:
| Target Load |
Actual Load |
ssj_ops |
| Target |
Actual |
| Calibration 1 |
|
|
83,210 |
| Calibration 2 |
|
|
88,081 |
| Calibration 3 |
|
|
88,477 |
| Calibration 4 |
|
|
88,757 |
| ssj_ops@calibrated=88,617 |
| 100% |
99.8% |
88,617 |
88,452 |
| 90% |
90.3% |
79,755 |
80,003 |
| 80% |
80.5% |
70,894 |
71,344 |
| 70% |
70.1% |
62,032 |
62,140 |
| 60% |
60.9% |
53,170 |
53,958 |
| 50% |
50.2% |
44,309 |
44,522 |
| 40% |
40.0% |
35,447 |
35,455 |
| 30% |
30.0% |
26,585 |
26,587 |
| 20% |
19.5% |
17,723 |
17,287 |
| 10% |
9.9% |
8,862 |
8,733 |
| Active Idle |
|
0 |
0 |
JVM 'Node_01.034' Scores:
| Target Load |
Actual Load |
ssj_ops |
| Target |
Actual |
| Calibration 1 |
|
|
86,044 |
| Calibration 2 |
|
|
90,188 |
| Calibration 3 |
|
|
90,470 |
| Calibration 4 |
|
|
90,264 |
| ssj_ops@calibrated=90,367 |
| 100% |
99.7% |
90,367 |
90,111 |
| 90% |
88.6% |
81,330 |
80,041 |
| 80% |
78.9% |
72,293 |
71,319 |
| 70% |
69.0% |
63,257 |
62,340 |
| 60% |
59.5% |
54,220 |
53,757 |
| 50% |
50.0% |
45,183 |
45,164 |
| 40% |
40.2% |
36,147 |
36,353 |
| 30% |
29.6% |
27,110 |
26,735 |
| 20% |
20.3% |
18,073 |
18,383 |
| 10% |
10.6% |
9,037 |
9,558 |
| Active Idle |
|
0 |
0 |
JVM 'Node_01.035' Scores:
| Target Load |
Actual Load |
ssj_ops |
| Target |
Actual |
| Calibration 1 |
|
|
86,474 |
| Calibration 2 |
|
|
90,372 |
| Calibration 3 |
|
|
90,733 |
| Calibration 4 |
|
|
90,698 |
| ssj_ops@calibrated=90,716 |
| 100% |
100.4% |
90,716 |
91,111 |
| 90% |
89.4% |
81,644 |
81,109 |
| 80% |
80.5% |
72,572 |
73,062 |
| 70% |
70.2% |
63,501 |
63,725 |
| 60% |
60.0% |
54,429 |
54,410 |
| 50% |
49.6% |
45,358 |
44,967 |
| 40% |
40.5% |
36,286 |
36,704 |
| 30% |
29.3% |
27,215 |
26,572 |
| 20% |
19.6% |
18,143 |
17,808 |
| 10% |
10.1% |
9,072 |
9,158 |
| Active Idle |
|
0 |
0 |
JVM 'Node_01.036' Scores:
| Target Load |
Actual Load |
ssj_ops |
| Target |
Actual |
| Calibration 1 |
|
|
86,045 |
| Calibration 2 |
|
|
90,581 |
| Calibration 3 |
|
|
90,363 |
| Calibration 4 |
|
|
91,344 |
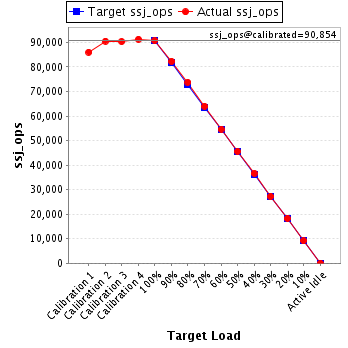
| ssj_ops@calibrated=90,854 |
| 100% |
99.9% |
90,854 |
90,774 |
| 90% |
90.6% |
81,768 |
82,349 |
| 80% |
81.2% |
72,683 |
73,792 |
| 70% |
70.5% |
63,598 |
64,026 |
| 60% |
60.1% |
54,512 |
54,630 |
| 50% |
50.2% |
45,427 |
45,604 |
| 40% |
40.3% |
36,341 |
36,655 |
| 30% |
30.0% |
27,256 |
27,288 |
| 20% |
20.1% |
18,171 |
18,279 |
| 10% |
10.1% |
9,085 |
9,133 |
| Active Idle |
|
0 |
0 |